Tuesday, January 11, 2011

Review of Quantitative Research Methodology

The students who are attending my Quantitative Research Methodology classes want me to post the results of this semester's review in this blog.

Types of statistics

1. Descriptive statistics: to describe numerical information about a particular group
e.g. You get data in the form of scores from the Writing class you’re teaching. You compute the mean of the scores to describe the students’ writing ability in average.

2. Inferential statistics: to describe numerical information about a particular sample and make inferences about the population.
e.g. You want to know the English proficiency of all students in a school. You draw a sample (50 students) and give an English test to the sample. After computing the mean, you make inferences about the English proficiency of all students (the population) from the results of the test of the sample.

Quantitative research methodologies

1. Descriptive research

Survey: to get information about a population from the sample.
e.g. You want to know the English proficiency of all students (the population) in a school, but you investigate only some students (the sample).

Census: to get information about a population from all of the members of this population.
e.g. You want to know the English proficiency of all students in a school and include all of them in the study.

Longitudinal study: to find out the development of the research subjects by investigating a particular group from year to year.
e.g. You want to know the development of vocabulary size of students aged 11 to 15 years old. To investigate their development, you have 30 students who are 11 years old. Every year you give them a vocabulary test to measure their vocabulary size. This study is carried out for 4 years.

Cross-sectional study: to find out the development of research subjects by investigating people of different ages at one time.
e.g. You want to know the development of vocabulary size of students aged 11 to 15 years old. To investigate their development, you have 30 students who are 11 years old, 30 students who are 12 years old, 30 students who are 13 years old, 30 students who are 14 years old, and 30 students who are 15 years old. You give them all a vocabulary test to measure their vocabulary size on the same day.

Correlational study: to find out the relationship between 2 variables.
e.g. You want to know whether there is a relationship between the students’ writing ability and grammar competence. In other words, you’re wondering if students who have good grammar competence tend to have better writing ability. (Click here to learn more about correlation.)

2. Experimental research
You can read about the basic concepts of experimental research in my previous post below. Click here if you cannot find this post.
There are several things you need to remember about experimental research.

a. Experimental research does not try to find out correlation or relationship between two variables. Rather, it tries to find out the differences between two groups--or, to be precise, two means of the groups.

b. In experimental research, you can use compute t value for the results of both pretest and posttest, rather than postttest only. The t-test applied to these two types of tests has different purposes:
You compute t value of pretest scores in order to ensure that the experimental and control groups are equal before you give treatment. (If they are not equal, you should repeat the random sampling procedure).
You compute t value of posttest scores in order to find out whether the experimental and control groups are different after you give treatment.

3. Ex-post Facto research (coming soon)

Wednesday, June 2, 2010

How to compute t value using t-test in MS Excel

There are several ways of computing t-test. You can do it manually, or use softwares to get the t value, such as SPSS and MS Excel. Here I'll tell you how to use MS Excel to compute the t value.

  • Write two sets of scores in MS Excel.
  • Click the function button (fx).


  • You will see pop-up box with a search box inside.


  • Write t test in the search box, and click Go.


  • Click T TEST in the box and click OK.
  • You will see these four boxes: array 1 (for the first set of scores), array 2 (for the second set of scores), tails (the direction of the difference), and type (the type of sample).


  • Enter the correct information in the boxes, and click OK.


  • Now you have the result.happybig hug

End of semester

You have learned about some basic concepts in education research this semester and hope they are useful in your thesis writing later. The lectures ended last Thursday, and this week you have a breakbig hug before taking the exam next week. It will be an oral exam, and I'm sure it will be more effective than the written one.whistlinghee hee

All the materials you need to study for the exam have been posted in this blog. If you still have questions about them you may ask me by writing them in the comment box.

I'm going to post some other things related to research, but they are not the materials of the lectures and will not be tested next week. The posts after this one are for the students who are writing skripsi.

Wish you lots of luck for the exam. thumbs up

Friday, May 28, 2010

Action Research

I have posted a few things about Action Research in my Student Teaching blog, so I won't repost it here. Click here to see the blog entry about Action Research.
big hugbig grinday dreaming

Experimental Research

You have learned about the difference between experimental and ex-post facto research herebatting eyelashes and here.batting eyelashes Let me review them a little bit.

Experimental research is conducted to determine cause and effect. For example, the topic of your research is:

The effects of using songs in the teaching of vocabulary on the students' vocabulary size.

You want to find out whether the use of songs (the cause) has effects on the students' vocabulary size. In this case, the independent variable is the use of songs, while the dependent variable is the students' vocabulary size.

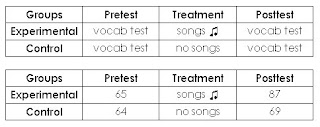
The design of the experimental research is like this:


You have two groups, experimental and control groups. You give both of them a pretest, which is a vocabulary test, at the beginning of the semester. Make sure that both groups are equal. After that, you teach vocabulary to both groups for one semester. You teach the experimental group using songs (treatment), while the control groups is taught vocabulary without using songs. At the end of the semester you give both groups a posttest, which is exactly the same as the pretest, and analyze the means of the posttest using t-test to find out whether there is a significant difference between teaching vocabulary using songs and without using songs.

Characteristics
There are 3 characteristics of experimental research.

1. Control
The control is applied to the condition of the subjects.
You have an experimental group, and you have a control group to make sure the treatment makes (or doesn’t make) a difference to the experimental group. You control the condition of both groups. Both should:
  • be of the same age
  • have equal ability
  • consist of equal number of males & females
  • etc.
2. Manipulation
This is not a negative term in experimental research!
It simply means the manipulation of the independent variable.
The independent variable of the research problem "The effects of using songs on the students’ vocabulary size" is the use of songs. You manipulate this variable by doing this:
  • The experimental group is taught using songs.
  • The control group is taught without using songs.
Songs and no songs, that's the manipulation.

3. Observation
This is not a qualitative observation!
It simply means you observe the difference between the experimental and control groups after you conduct the experiment. You have to do statistical analysis (t-test) to find out whether there is a significant difference between the two groups.

Selecting the sample
You need two processes to select the sample of your experimental research.

1. Random sampling: selecting the sample from the population randomly, e.g.
10 classes of eight graders (population)

2 classes of eight graders (sample)

2. Random assignment: assigning the sample into 2 groups (experimental & control) randomly, e.g.
Class C experimental group
Class F control group

The above processes can be described in the chart below.

Wednesday, May 26, 2010

Research Methodologies

Descriptive research
Purpose:

1. To describe a phenomenon, for example:
To what extent do the tenth graders use a dictionary in reading comprehension?
How can computer games be used to teach vocabulary to the fourth graders?

2. To explore a phenomenon, for example:
Slide 3What were the obstacles in implementing international standard in SMA 3?
Why did SMA 3 face those obstacles?
How did SMA 3 overcome the obstacles?


Experimental research
Purpose: to determine cause & effect, for example:
Does the use of L1 subtitles have an effect on the tenth graders’ listening comprehension?
Is there a significant difference in speaking ability between fifth graders who are taught grammar and those who are not?


Ex Post Facto research
Purpose: to predict cause & effect, for example:
Is there a significant difference in speaking ability between university students who learned English in primary schools and those who did not?
Do the students who are extrovert learn English better than those who are introvert?

Saturday, May 22, 2010

Validity and Reliability

Reliability is the consistency of a test in measuring something.

If you give the same test to the same student three times and the results are 80 - 65 - 90, the test is not consistent in measuring the students' ability. The test has low reliability.feeling beat up
If you give the same test to the same student three times and the results are 85 - 85 - 85, the test is consistent in measuring the students' ability. The test has perfect reliability.big hug

Reliability is not black and white, you cannot say the test is either reliable or not reliable. Instead you have to express the reliability in the form of degrees: very low, low, moderate, high, very high, perfect. (Remember about this when we talked about correlation in the statistics classes?)

Methods of estimating reliability are:
  1. Test-retest: one test, administered twice.
  2. Equivalent form: two similar tests, administered once.
  3. Split-half: one test, administered once, split into two parts (odd & even numbers)
  4. Internal consistency: one test, administered once, apply KR 21 formula.
  5. Interrater reliability: one test, administered once, scored by 2 people.
Which method should you use?
If you use an objective test in your skripsi, I suggest internal consistency (KR21).
If you use an essay test, I suggest internal consistency (Cronbach Alpha).
If you use a writing test, I suggest interrater reliability (Pearson r).

Validity refers to the relevance of the content of test in measuring something.

If you use a math test to measure the students' English proficiency, the test is not valid.feeling beat up
If you use a reading test to measure the students' writing ability, the test has very low validity.d'oh
If you use a reading test to measure the students reading ability, the test has very high validity.dancing

Methods of estimating validity:
  1. Content validity: the test should representatively contain the items that are supposed to be measured. Map the content of your test against the content of the curriculum/syllabus/lesson plans. If they match, your test has high content validity.
  2. Criterion-related validity: the content of a test is related with another test (a criterion). Correlate the results of your test and the results of a standardized test (the criterion). If the correlation is high, your test has high validity, too.
  3. Construct validity: the test should measure the construct well, e.g. a reading test should measure the construct 'reading comprehension', a grammar test should measure the construct 'grammar ability', etc.
Criterion-related validity can be measures in two ways:
  1. Concurrent validity: Administer your test and the standardized test at the same time, e.g. administer your test and the standardized test today.
  2. Predictive validity: Administer your test, then administer the standardized test after several months have passed, e.g. administer your test today, administer the standardized test next semester.

Construct validity can also be measured in two ways:
  1. Pilot study: administer the test to two groups of subjects, one group has the construct while the other does not have the construct. If the former scores higher than the latter, the test has construct validity.
  2. Intervention study: administer the test to a group who does not have the construct as a pretest. Give treatment to the group by teaching the construct, then give them a posttest. If there's a significant difference between the results of pretest & posttest, the test has construct validity.
Which method should you use?
If you use an objective test in your skripsi, I suggest content or concurrent validity.
If you use an essay or writing test, I suggest content validity.