Wednesday, June 2, 2010

How to compute t value using t-test in MS Excel

There are several ways of computing t-test. You can do it manually, or use softwares to get the t value, such as SPSS and MS Excel. Here I'll tell you how to use MS Excel to compute the t value.

  • Write two sets of scores in MS Excel.
  • Click the function button (fx).


  • You will see pop-up box with a search box inside.


  • Write t test in the search box, and click Go.


  • Click T TEST in the box and click OK.
  • You will see these four boxes: array 1 (for the first set of scores), array 2 (for the second set of scores), tails (the direction of the difference), and type (the type of sample).


  • Enter the correct information in the boxes, and click OK.


  • Now you have the result.happybig hug

End of semester

You have learned about some basic concepts in education research this semester and hope they are useful in your thesis writing later. The lectures ended last Thursday, and this week you have a breakbig hug before taking the exam next week. It will be an oral exam, and I'm sure it will be more effective than the written one.whistlinghee hee

All the materials you need to study for the exam have been posted in this blog. If you still have questions about them you may ask me by writing them in the comment box.

I'm going to post some other things related to research, but they are not the materials of the lectures and will not be tested next week. The posts after this one are for the students who are writing skripsi.

Wish you lots of luck for the exam. thumbs up

Friday, May 28, 2010

Action Research

I have posted a few things about Action Research in my Student Teaching blog, so I won't repost it here. Click here to see the blog entry about Action Research.
big hugbig grinday dreaming

Experimental Research

You have learned about the difference between experimental and ex-post facto research herebatting eyelashes and here.batting eyelashes Let me review them a little bit.

Experimental research is conducted to determine cause and effect. For example, the topic of your research is:

The effects of using songs in the teaching of vocabulary on the students' vocabulary size.

You want to find out whether the use of songs (the cause) has effects on the students' vocabulary size. In this case, the independent variable is the use of songs, while the dependent variable is the students' vocabulary size.

The design of the experimental research is like this:
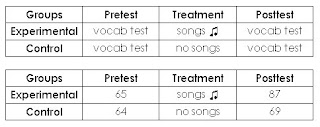

You have two groups, experimental and control groups. You give both of them a pretest, which is a vocabulary test, at the beginning of the semester. Make sure that both groups are equal. After that, you teach vocabulary to both groups for one semester. You teach the experimental group using songs (treatment), while the control groups is taught vocabulary without using songs. At the end of the semester you give both groups a posttest, which is exactly the same as the pretest, and analyze the means of the posttest using t-test to find out whether there is a significant difference between teaching vocabulary using songs and without using songs.

Characteristics
There are 3 characteristics of experimental research.

1. Control
The control is applied to the condition of the subjects.
You have an experimental group, and you have a control group to make sure the treatment makes (or doesn’t make) a difference to the experimental group. You control the condition of both groups. Both should:
  • be of the same age
  • have equal ability
  • consist of equal number of males & females
  • etc.
2. Manipulation
This is not a negative term in experimental research!
It simply means the manipulation of the independent variable.
The independent variable of the research problem "The effects of using songs on the students’ vocabulary size" is the use of songs. You manipulate this variable by doing this:
  • The experimental group is taught using songs.
  • The control group is taught without using songs.
Songs and no songs, that's the manipulation.

3. Observation
This is not a qualitative observation!
It simply means you observe the difference between the experimental and control groups after you conduct the experiment. You have to do statistical analysis (t-test) to find out whether there is a significant difference between the two groups.

Selecting the sample
You need two processes to select the sample of your experimental research.

1. Random sampling: selecting the sample from the population randomly, e.g.
10 classes of eight graders (population)

2 classes of eight graders (sample)

2. Random assignment: assigning the sample into 2 groups (experimental & control) randomly, e.g.
Class C experimental group
Class F control group

The above processes can be described in the chart below.

Wednesday, May 26, 2010

Research Methodologies

Descriptive research
Purpose:

1. To describe a phenomenon, for example:
To what extent do the tenth graders use a dictionary in reading comprehension?
How can computer games be used to teach vocabulary to the fourth graders?

2. To explore a phenomenon, for example:
Slide 3What were the obstacles in implementing international standard in SMA 3?
Why did SMA 3 face those obstacles?
How did SMA 3 overcome the obstacles?


Experimental research
Purpose: to determine cause & effect, for example:
Does the use of L1 subtitles have an effect on the tenth graders’ listening comprehension?
Is there a significant difference in speaking ability between fifth graders who are taught grammar and those who are not?


Ex Post Facto research
Purpose: to predict cause & effect, for example:
Is there a significant difference in speaking ability between university students who learned English in primary schools and those who did not?
Do the students who are extrovert learn English better than those who are introvert?

Saturday, May 22, 2010

Validity and Reliability

Reliability is the consistency of a test in measuring something.

If you give the same test to the same student three times and the results are 80 - 65 - 90, the test is not consistent in measuring the students' ability. The test has low reliability.feeling beat up
If you give the same test to the same student three times and the results are 85 - 85 - 85, the test is consistent in measuring the students' ability. The test has perfect reliability.big hug

Reliability is not black and white, you cannot say the test is either reliable or not reliable. Instead you have to express the reliability in the form of degrees: very low, low, moderate, high, very high, perfect. (Remember about this when we talked about correlation in the statistics classes?)

Methods of estimating reliability are:
  1. Test-retest: one test, administered twice.
  2. Equivalent form: two similar tests, administered once.
  3. Split-half: one test, administered once, split into two parts (odd & even numbers)
  4. Internal consistency: one test, administered once, apply KR 21 formula.
  5. Interrater reliability: one test, administered once, scored by 2 people.
Which method should you use?
If you use an objective test in your skripsi, I suggest internal consistency (KR21).
If you use an essay test, I suggest internal consistency (Cronbach Alpha).
If you use a writing test, I suggest interrater reliability (Pearson r).

Validity refers to the relevance of the content of test in measuring something.

If you use a math test to measure the students' English proficiency, the test is not valid.feeling beat up
If you use a reading test to measure the students' writing ability, the test has very low validity.d'oh
If you use a reading test to measure the students reading ability, the test has very high validity.dancing

Methods of estimating validity:
  1. Content validity: the test should representatively contain the items that are supposed to be measured. Map the content of your test against the content of the curriculum/syllabus/lesson plans. If they match, your test has high content validity.
  2. Criterion-related validity: the content of a test is related with another test (a criterion). Correlate the results of your test and the results of a standardized test (the criterion). If the correlation is high, your test has high validity, too.
  3. Construct validity: the test should measure the construct well, e.g. a reading test should measure the construct 'reading comprehension', a grammar test should measure the construct 'grammar ability', etc.
Criterion-related validity can be measures in two ways:
  1. Concurrent validity: Administer your test and the standardized test at the same time, e.g. administer your test and the standardized test today.
  2. Predictive validity: Administer your test, then administer the standardized test after several months have passed, e.g. administer your test today, administer the standardized test next semester.

Construct validity can also be measured in two ways:
  1. Pilot study: administer the test to two groups of subjects, one group has the construct while the other does not have the construct. If the former scores higher than the latter, the test has construct validity.
  2. Intervention study: administer the test to a group who does not have the construct as a pretest. Give treatment to the group by teaching the construct, then give them a posttest. If there's a significant difference between the results of pretest & posttest, the test has construct validity.
Which method should you use?
If you use an objective test in your skripsi, I suggest content or concurrent validity.
If you use an essay or writing test, I suggest content validity.

Tuesday, May 18, 2010

Research Instruments

Research instruments are the tools that you use to get data (words or numbers).

The instruments commonly used in educational research are: tests, questionnaires, interviews and observations.

Tests are categorized into two types:
  1. Objective tests, such as true-false, multiple choice, matching, completion, etc.
  2. Subjective tests, such as essay and writing tests.
If you use a test as the research instrument, you need to estimate the reliability and validity of the test. These characteristics of the test will be elaborated in a different entry.

Questionnaires are categorized into two types:
  1. Structured: It has a fixed number of questions and a limited choice of answers. The respondents should choose one or more suitable answers. The aim of administering this questionnaire is to get facts.
  2. Unstructured: It consists a number of questions. The answers are in the form of essay and the content may vary depending on the respondents. The aim of administering this questionnaire is to explore something.
Interviews are categorized into three types:
  1. Structured: It has a fixed number of questions and limited choice of answers. It's like a structured questionnaire, but the questions are spoken by the researcher to the respondents.
  2. Semi-structured: It has a few questions as guidelines, and can be added when necessary.
  3. Unstructured: There are no questions at all in the beginning. The researcher determines the questions after immersing in the field for some time. The things to be asked will appear after the immersion.
Observations are categorized into two types:
  1. Participatory: The researcher participates in the activities of the subjects, e.g. You conduct a study in SMA 1 and replace the teacher in the classroom. You teach and observe the students.
  2. Non-participatory: The researcher does not participate in the activities of the subjects, e.g. You conduct a study in SMA 1. You only sit in the back of the classroom and observe the teaching-learning process.
When you observe your research subjects, you need one of these two things to help you collect data:
  • Checklist: a list of things that you look at when observing something/someone.
  • Field notes: anything you write when observing something/someone.

Wednesday, April 28, 2010

Sampling

Population is all people we want to investigate.
Sample is a part of the population.
Q: Why should we draw a sample from the population?
A: Because the population is too large and should be reduced to enable investigation.


Types of Sampling

1. Probability sampling
We draw the sample randomly. This type of sampling is used in quantitative research, but never used in qualitative research.

a. Simple random sampling
It means everybody has an equal chance of being selected as a sample. You draw the sample by choosing individual students randomly. For example, you have 100 students in the population so write the students' names on 100 small pieces of paper. Fold the pieces of paper and put them in a bowl. Shake the bowl, then take 30 pieces of paper randomly from the bowl. Now you have 30 students as the sample of your study.

b. Stratified sampling
The population is divided into several strata/levels, then the sample is drawn from each level. For instance, you want to conduct research at SMAN 5. There are three grades: the 10th grade, the 11th grade and the 12 grade. These grades are the levels, which can be used as a basis to draw the sample. List the number of the students from the highest to the lowest level, then draw a sample from each level.

c. Cluster sampling
The population is divided into several clusters/groups, then a sample is drawn from each group. For example, you want to conduct research to the tenth graders. If there are five classes (clusters), list the number of the students in these classes and draw a sample from each class.

d. Systematic sampling
The sample is drawn by selecting the n-th person in the population. For example, there are 150 students in the population and you need 30 students in your sample. Divide the number of students in the population (150) by the number of students in the sample (30), you get 5.
150 : 30 = 5
It means you could draw the sample by choosing every 5th student in the list.

2. Non-probability sampling

We do not draw the sample randomly. It is used in qualitative and quantitative research.

a. Accidental sampling
Choosing any person that you meet as the sample.

b. Purposive sampling
Selecting a sample from the population for a particular reason. This is used in qualitative research, but not quantitative research. For example, you conduct research to find out the strategies of proficient readers in comprehending a narrative text. You need to draw a sample from a reading class, and choose 8 proficient readers by taking the teacher's judgement into account. Ask the reading teacher which students are proficient readers, then you could select 8 out of several students mentioned by the teacher.

c. Quota sampling
Dividing the population into levels, then selecting n % from each level. For example, you list the 11th graders belonging to programs A1, A2, A3 and A4. Because the number of students in these programs varies, it is better to use quota sampling by taking 10% of students in each program as your sample.

How to review the literature

There are three things you should consider in reviewing the literature in Chapter 2.

1. Organization
How do you organize the ideas in Chapter 2? Begin this chapter by explaining the most general ideas, then write the more specific ideas. So the organization is: general --> specific.

For example, I wrote a thesis titled "The Use of Context Cues by the Students of English IKIP Malang in Reading Comprehension". The most general idea is reading comprehension, and the most specific one is context cues, so I organized Chapter 2 in this way:


2. Quoting, Paraphrasing & Summarizing
You have learned about them in the course Academic Writing 1, haven't you? Here is a little review:
  • Don’t quote too much, only the sentences that you cannot paraphrase or summarize.
  • Restate other authors’ ideas in your own words most of the time. (In other words, paraphrase most of the time.)
  • If the texts are too long, summarize the ideas.

3. Taking Notes
Make notes directly as you read books, journal, papers, and theses/dissertations. Usually you read lots of them, so if you find a relevant idea and don't take notes immediately, you may forget which idea in which book.
Softwares are available to help you do this, such as Endnote. The use of cards is not recommended because:
  • It takes longer time to make them.
  • You use paper, which means more trees have to be cut down. This is not environmentally friendly.

Sunday, April 25, 2010

Online resources

In my lectures I mentioned that you may quote relevant texts from online journals or conference proceedings. Here are some journals and proceedings that may be useful for your thesis writing.

Journals

The Internet TESL Journal

English Teaching Forum

Reading in a Foreign Language

The Electronic Journal for English as a Second Language


Conference Proceedings

KOTESOL Conference Proceedings

AARE Conference Proceedings

Saturday, April 24, 2010

Some terms

There are some terms you need to know when you conduct research and write a thesis. Here they are.

ooOoo

A concept is a word that refers to an object or an event.
Example: book, table, jump, slow, loud, shiver.
You can perceive them using your senses. You can see a book or a table, you can see someone jump, you can see a slow thing, you can hear something loud, etc.

A construct is a psychological concept.
Example: motivation, intelligence, reading ability, language acquisition.
You cannot perceive them using your senses because they are 'psychological'. Even if you open someone's head, you cannot see their intelligence, motivation, or reading ability. But they exist!

ooOoo

Constitutive definition: a word is defined by using other words.
Example:
A student is a person studying in a school or a university.
Conference proceedings can be defined as a collection of scientific papers presented in a conference.

Operational definition: a word is defined by mentioning the operation that must be done to measure the concept/construct.
Example:
Intelligence quotient is defined as the scores on the Stanford-Binet Test of Intelligence.
English proficiency is defined as the scores of Test of English as a Foreign Language (TOEFL).

ooOoo

A variable is something that varies.
Example:
Age can be 12 years old, 38 years old, 50 years old, etc. Age varies so it is a variable.
Gender can male or female. Gender varies so it is a variable.
English proficiency can be good, average or poor. English proficiency varies so it is a variable.

Quantitative and Qualitative Research

Quantitative and qualitative are two differrent approaches to research. In fact, they are very, very different, like fire and ice. Theoretically, you cannot do both in a single study. However, in practice sometimes it is possible to use both approaches in a study (see mixed method in a previous entry).

I have explained how the two differ in my 'Research Methodology' lectures, and now I post the table showing their differences below as you said you needed my slides. (If you think the size of the letters is too small and you find it hard to read, just click the image and you will see the larger version. You can save it to your hard drive.)


In general that's how they differ. The procedure of conducting both research is actually also different. Please see the image below.


When you conduct quantitative research, you begin by stating the research questions, and based on them you formulate hypotheses. After that, you collect data, analyze them, and report the findings which result from the analysis. So the process is quite linear, like a straight line.

When you conduct qualitative research, you begin by collecting preliminary data in the field. You have to go to the field to collect data, and based on the data you could state the research questions. Next, you return to the field and collect more data. It is possible (not always) that you do not get the data you want. In this case, you have to revise the research questions. That's why I draw an arrow connecting research questions and data collection in the above picture. After revising the research questions, you can go to the field again and collect data. Then you could analyze the data and report the findings. The process of conducting qualitative research can be (again, not always) like a spiral.


If you have questions, just write them in the comment box. I'll try to answer them as soon as possible.

Monday, April 19, 2010

About the slides

Some students asked me to post the slides I used in Research Methodology classes because they still found it hard to understand the content of the lectures. Well, personally I don't recommend you to study the slides because they only contain the important points without any further explanations. I'll try to write blog entries about them here, and hopefully by this weekend I could finish writing the entries.

Friday, April 9, 2010

Review of Literature

You have to review the literature when conducting research for some good reasons:

1. To define the frontiers of the field.
2. To place your research questions in perspective.
3. To limit your research questions and define the concepts of the study.
4. To understand the contradictory results in an area.
5. To choose the most appropriate methodology.
6. To avoid unintentional replication.
7. To help interpret the significance of the study.

Basically you review theories and previous studies which are relevant to the topic of your research. You could read them in the following scientific texts:
- books
- journals
- conference papers
- theses or dissertations

...BUT NOT the following popular texts:
- newspapers
- magazines
- encyclopedias

One of you asked me, "Can we quote resources from the internet?" Well, yes, you can. However, I usually allow my students to quote two types of online resources only: ebooks and ejournals. These two have been reviewed and edited by experts before being published online, so you could quote them. Quoting websites and blogs are strongly not recommended because no one reviewed the contents before they are published online.

Thursday, March 4, 2010

Experimental & Ex-post Facto Research

In the last session I provided a brief overview of the experimental and ex-post facto designs. Basically here is how they differ.

Experimental

Research question: Are songs effective to teach listening comprehension?

Design:

You draw the sample randomly from the population.
Then you assign the sample into an experimental and control groups also randomly.
You give a treatment to the experimental group, but not to the control one.


Ex-post Facto

Research question: Does learning English in elementary school affect the university students’ speaking ability?

Design:

There is no randomization here.
You select the subjects on the basis of a certain existing condition.
You do not give treatment to any group because:
1. the “treatment” already happened in the past and you can no longer do anything about it, or
2. it is unethical to give a treatment to the ex-post facto group.

We will discuss more about the above designs near the end of this semester.

Saturday, February 20, 2010

Some issues about research

In the last session you asked me lots of good questions about research. I need to post the issues you addressed here.

1. Terms
These terms are synonymous: research, study, investigation, inquiry.
So in this context, study is not the same as learn. Rather, it refers to research.

2. Quantitative vs. Qualitative
Which one is better? Good question! The answer is: both.
The best research is the one that can provide the most appropriate answer to your research questions (problems). If you are wondering whether your teaching technique is effective and want to find out how many students can succeed when taught using that technique, then you must conduct quantitative research. If you conduct qualitative research to find out about this, then you're heading for the wrong direction. In this case, quantitative research is better than qualitative one.
But if you want to know how to apply a certain teaching technique in the classroom, then you must conduct qualitative research. In this case qualitative research is better than quantitative one.

3. Quantitative and Qualitative
One of you asked whether you could use both the quantitative and qualitative approaches in a single study. Good news, the answer is: yes. It's called mixed method. You need it when you have, for example, the following research questions:
1.
How can songs be used to teach English to the 5th graders at Mbebekan elementary school? (qual.)
2. Can the use of songs improve the 5th graders' vocabulary size? (quan.)

4. Observation

The example of quantitative & qualitative observation can be downloaded here.

5. Questionnaire
The example of quantitative & qualitative questionnaire can be downloaded here.

Saturday, February 13, 2010

Basic Course Outline

OK, so you’ve learned about statistics in my classes last semester. Statistics is just a tool to analyze data in research. You’ll find out more about the relationship between statistics and research in the Research Methodology course. Please download the BCO here.